modeling a mathematical shape
Printed From: CAD Forum
Category: EN
Forum Name: AutoCAD
Forum Description: Discussion about AutoCAD and AutoCAD LT, viewers, DWG and DXF formats, Design Review, AutoCAD web, Drive, add-ons
URL: https://www.cadforum.cz/forum_en/forum_posts.asp?TID=12217
Printed Date: 05.Sep.2026 at 04:16
Topic: modeling a mathematical shape
Posted By: Frank98
Subject: modeling a mathematical shape
Date Posted: 15.Feb.2017 at 21:28
|
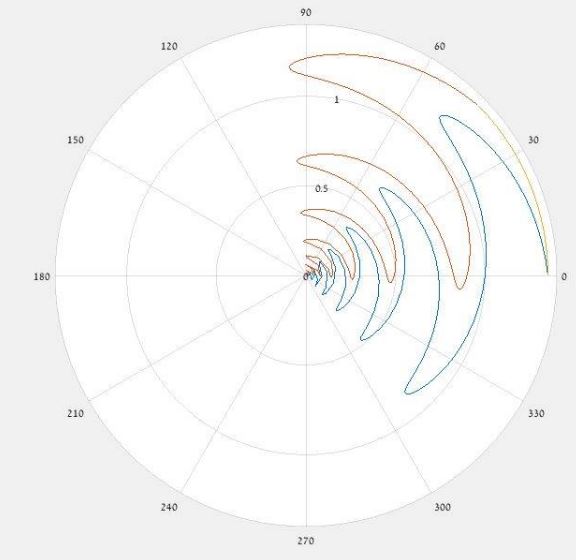
how can i model such a plot in autocad. this plot what created using a mathematical formula ,demostrated in mathlab. thanks
 |
Replies:
Posted By: Kent Cooper
Date Posted: 15.Feb.2017 at 22:13
|
The equations would be necessary.... That looks like some kind [two kinds, really] of formula in which the angle to a point on the curve is based on the inverse of a trigonometric function whose value swings between positive and negative without ever going to infinity [such as sine or cosine], applied to some multiplier of the local radius, and for the browner curve with a constant angle [looks like 45 degrees] added to the result. That shouldn't be very hard to work out -- for a related routine that draws polynomial functions [y = ax^n + bx^(n-1) + .... + px^2 + qx + r], see my PolynomialFunction.lsp routine, available http://cadtips.cadalyst.com/lisp-code-modules/draw-polynomial-functions" rel="nofollow - here . But this one, being radial, would not involve X and Y coordinates, but instead (polar) functions measured from the origin as basepoint, in a (repeat) function stepping through small increments of radius as the distance arguments, and calculating the angle arguments for each based on the equation, and presumably used in a SPLINE, or perhaps a POLYLINE that you could spline-curve to smooth it out.
|
Posted By: Vladimir Michl
Date Posted: 17.Feb.2017 at 08:34
|
You can use our 2DPLOT utility (see http://www.cadstudio.cz/en/apps/2dplot/" rel="nofollow - http://www.cadstudio.cz/en/apps/2dplot/ ). You equation then should be expressed in cartesian space (X/Y): ; for range (0-1.5> (defun fPolar1 (u / r tau alfa R0) ;x = (* r (cos th)) ;y = (* r (sin th)) (setq r u) (setq tau 1.1) ; example (setq alfa 1.0) ; example (setq R0 0.1) ; example (setq th (* alfa (sin (/ (* pi (log (/ r R0))) (log tau))))) ; your expression (list (* r (cos th)) (* r (sin th))) ; return (X Y) ) Then call: (2Dplot fPolar1 0.001 1.5 0.001) meaning - draw my function "fPolar1" from 0.001 to 1.5 (the radius), with ministeps of 0.001 ------------- Vladimir Michl (moderator) https://www.linkedin.com/in/vmichl/" rel="nofollow - LinkedIn , Autodesk Expert Elite |
Posted By: Kent Cooper
Date Posted: 17.Feb.2017 at 20:56
|
Another, (polar)-based, solution (along with Vladimir's solution above) is over http://https://forums.autodesk.com/t5/autocad-2013-2014-2015-2016-2017/modeling-a-mathematical-shape/m-p/6886507#M163554" rel="nofollow - here . See also other Posts in that same thread.
EDIT: That link doesn't seem to work. Try copy/pasting this: https://forums.autodesk.com/t5/autocad-2013-2014-2015-2016-2017/modeling-a-mathematical-shape/m-p/6886507#M163554
|